Background
Wind and solar resources are abundant throughout the world, but their dependence on uncontrollable factors such as weather has been one of the biggest impediments to their development.
However in recent years, countries such as Denmark and Germany have pioneered and adopted strategies, planning tools, and technologies to cost-effectively and reliably manage these integration challenges.
By leveraging these strategies, practices, and technologies early in the evolution of their electricity grid systems…
African and other developing economies could leapfrog to clean, reliable, low-impact, and cost-efficient energy systems and avoid increasingly riskier investments in coal and large hydroelectric dam projects.
The Report
In this paper, we examine several recent studies to assess the prospects for renewable energy development in developing countries, with a particular emphasis on African countries.
We first demonstrate that the changing economics of wind and solar technologies are making them increasingly cost-effective, while coal and large hydroelectric projects are becoming riskier investments due to significant cost overruns, uncertainty in future fuel costs, and climate change.
We then present the evidence of large potential for wind and solar resources and discuss opportunities for their development with low social and environmental impacts.
Finally, we highlight different emerging strategies that are being deployed around the world to efficiently manage the variability and uncertainty of large-scale grid-connected wind and solar energy generation.
See Inside
Comparison of annual average capacity factors (A) and adjusted capacity factors for the daily top three peak hours (i.e., capacity value) (B) for wind zones in the Eastern and Southern African Power Pools.
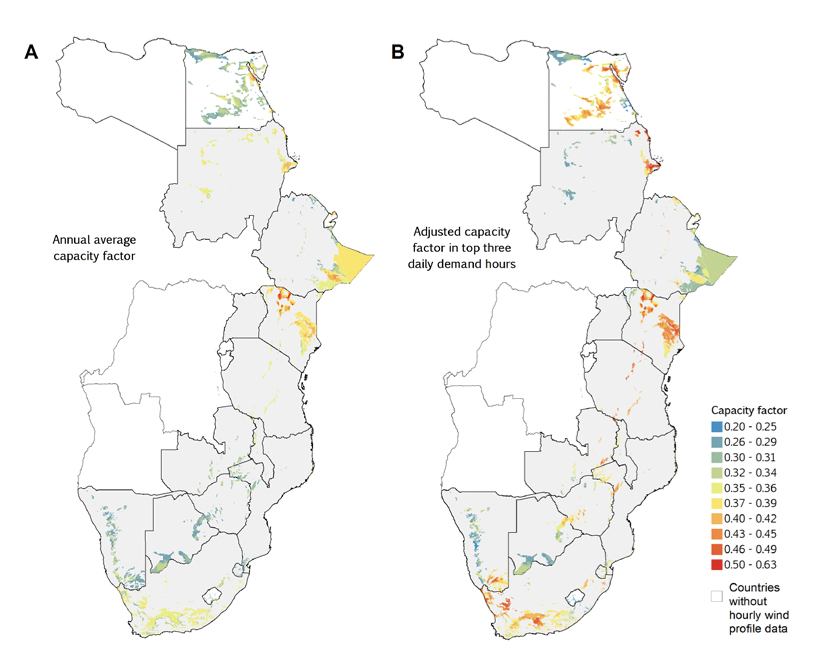
Some wind zones with high annual average capacity factors for wind generation (yellow to red) have low capacity value (blue to yellow), while some areas with relatively low annual average capacity factors (blue to yellow) have high capacity value (yellow to red). This figure is reproduced from Wu et al, 2015.